

In the last post that I wrote “What is the FIRE Movement” I mentioned the 4% rule. I stated that a 4% withdrawal rate is a common rate used in the FIRE community and that I would discuss it in more detail in a future post…Well you guessed it, in this post I am going to deep dive into the roots of the 4% rule. My goal is to explain the research that this rule was derived from in an easy to understand way.
In 1998 a three professors from Trinity University, (Phillip Cooley, Carl Hubbard and Daniel Walz) published an article titled “Retirement Savings: Choosing a Withdrawal Rate That is Sustainable”. This study is now commonly known and referred to as the Trinity Study and is referenced quite frequently in the FIRE community as the basis for the 4% rule.
What Was the Trinity Study
The Trinity study measured the impact of withdrawal rates on several portfolio allocations for different lengths of time and used historical market data to measure the portfolio success rates. This will be more clear as you look over the charts below.
The time frame used for this study was from 1926 to 1995 and the portfolio allocations included the following:
- 100% stocks
- 75% stocks & 25% bonds
- 50% stocks & 50% bonds
- 25% stocks & 75% bonds
- 100% bonds
Understanding the Results
Below are the four tables that the researchers created to test the portfolio success rates in different scenarios.
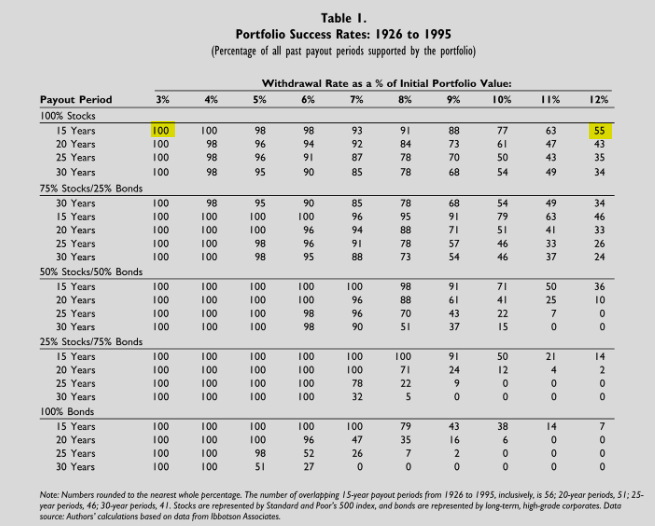
Table 1 is the most basic of the four, it measures the portfolio success rates for each payout period during the span from 1926 to 1995.
Reading the Table
On the left vertical axis you have the five portfolios each broken down by payout periods of 15, 20, 25, and 30 years. On the top horizontal axis you have the withdrawal rates spanning from 3% to 12%. The numbers in the center of the table indicate the portfolios success rate that corresponds with the payout period and withdrawal rate. For example if you look at the table below the highlighted number on the left under the 100% stocks section is saying that a portfolio with 100% stocks that has a payout period of 15 years and a 3% withdrawal rate had a success rate of 100% from 1926-1995. Then if you look at the highlighted number on the right you can tell that this same portfolio with a withdrawal rate of 12% only had a 55% success rate.
If you look at the title for table 2 you will realize that the dates are for a 50 year time span (1946-1995) rather than the 70 year time span in table 1. The researchers believed that this data was important to show because between 1926-1946 the capital markets were impacted by major events such as the great depression and World War II. Thus, by excluding those years you have a more realistic idea for portfolio performance.
If you compare the two tables you may notice that in table 2 portfolio success rates overall are higher across the board. The top three portfolio allocations have a 100% success rate for all payout period up to a 7% withdrawal rate. It’s clear that these major events impacted portfolio performances. In my opinion I believe that table 1 offers stronger data because random events like the great depression and World War II could happen again and should be considered when choosing a safe withdrawal rate.
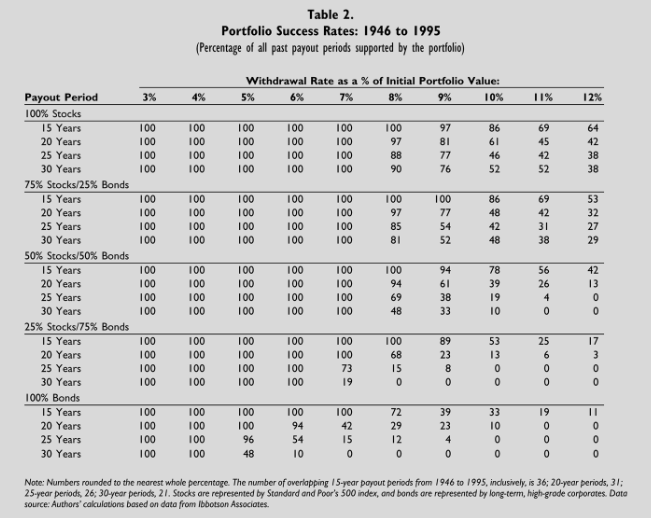
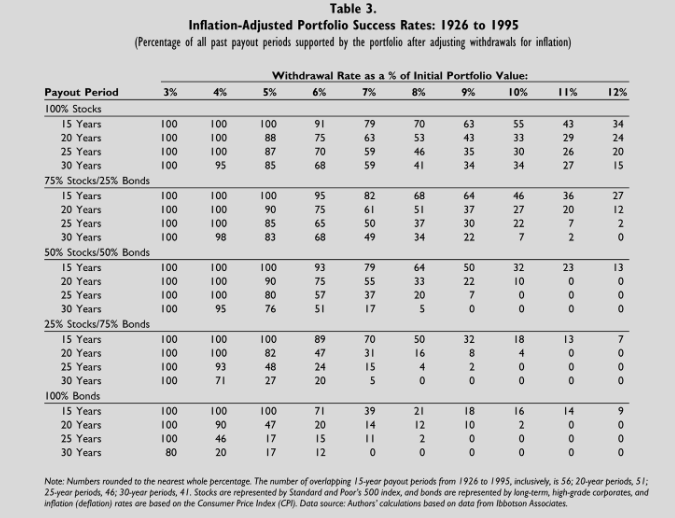
Table 3 uses the same time frame as table 1 (1926-1995) but it also takes inflation into consideration. Inflation and deflation will occur over the years and it will have an effect on your portfolio performance if you do not take it into consideration. In order to counter these effects you will want to take a withdrawal rate that is smaller than your portfolios annual growth rate and apply that to the growing value of your portfolio. This will allow the amount you withdrawal to adjust will inflation.
By comparing table 3 to table 1 it can be seen that the portfolio success rates are significantly impacted after adjusting for inflation. However a withdrawal rate between 3%-4% still has a strong success rate across the majority of portfolios.
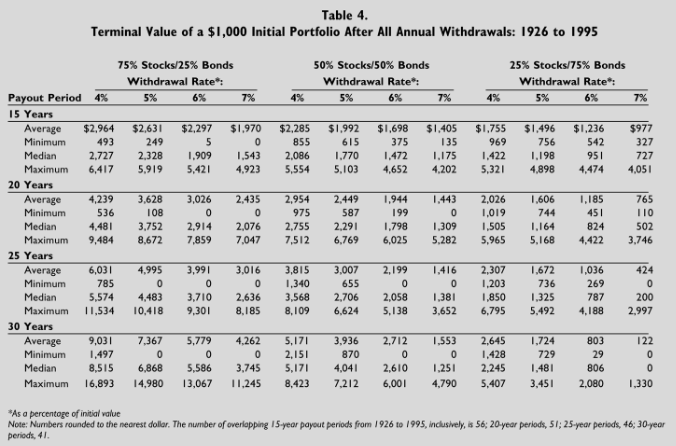
In table 4 the researchers show you what the terminal value of a $1,000 portfolio would be based on historical market data, payout periods, withdrawal rates and portfolio allocations. As you may notice they do not include the 100% stock portfolio or the 100% bond portfolio and they only use withdrawal rates between 4% and 7%.
So, let’s say look at a portfolio allocation of 75% stocks and 25% bonds, a withdrawal rate of 5% and a payout period of 30 years. According to this information, if we had a portfolio of $1,000 and annually withdrew 5% for 30 years we can expect on average our portfolio will be worth $7,367. The best 30-year period between 1926-1995 would result in a portfolio value of $14,980 and the worst 30-year period would result in a portfolio value of $0.
If you look closely across all portfolios and payout periods you will notice that a withdrawal rate of 4% is the only rate that never returns a terminal value of $0.
Key Takeaways
After going over a quick synopsis of the trinity study there are three major takeaways based on their research.
- If you are planning on retiring early (ie a 30-year payout period) a withdrawal rate of 3%-4% will provide the best success rate.
- Inflation matters and should be accounted for when planning your withdrawal strategy.
- The withdrawal rate that is right for you is heavily based on your expected payout period and risk tolerance.
Warning: Based on Historical Data
It’s important to understand that this information is based on historical information and does not mean that these results will also occur in the future. Just because from 1926-1995 a portfolio allocation of 100% stocks with withdrawal rate of 4% for a 30 year payout period yields a success rate of 95% does not mean that will be the same results for you from 2026-2095.
The 4% rule is referenced quite often in the FIRE community as the ideal safe withdrawal rate. As you can see from the tables above, the Trinity study did not account for payout periods greater than 30 years. If you retire early at 30 and live till 80 you will have a payout period of 50 years. Based on this study it is unknown if 4% is a safe withdrawal rate for that length of time. OK rant over. I just wanted to put that out there so you understand the risks when relying on the 4% rule.
Closing Thoughts
Over the years that I’ve followed the FIRE movement I’ve often heard the Trinity study referenced over and over again but I never got a full explanation. I really hope that this post has provided you insight on the research that was conducted for the Trinity study and that you now have a better understanding of why 4% is believed to be a safe withdrawal rate for early retirees. Lastly, be wary of the 4% rule and don’t buy in 100% things change over time and we must be able to adapt. If you interested in reading through the full Trinity study click here.
If you enjoyed this post please share with your friends and let us know your thoughts below in the comment section.
Interested in learning more about investing? Check out these posts: